
Our Strategy Development Process
At Ninjabots, every strategy goes through a rigorous, multi-stage development process designed to eliminate curve-fitting, avoid unrealistic results, and deliver consistent, reliable systems that traders can trust. We focus on robustness and risk-adjusted performance, not flashy equity curves that collapse in live trading.
Why our Development Process Matters
Most strategies you’ll find online look great in a backtest but collapse in live trading. Why? Because they’re curve-fit, over-optimised, or built on unrealistic assumptions.
At Ninjabots, we do things differently:
- Robust, Not Curve-Fit — Strategies are tested across multiple market regimes, instruments, and unseen data to avoid over-fitting.
- Realistic, Not Flashy — We use out-of-sample testing, Monte Carlo analysis, and live SIM trading to make sure results translate from backtest to real markets.
- Transparent, Not Misleading — All backtests include realistic assumptions for slippage and commissions, so any performance data you see reflects real-world trading costs.
- Consistent, Not Fragile — Only systems that deliver strong risk-adjusted performance make it to market.
The result? Reliable, trader-ready strategies that emphasise value, consistency, and realistic performance—not just pretty equity charts.
Standard vs. Premium Strategies
At Ninjabots, every strategy must pass our rigorous 6-step development process before release. Both Standard and Premium products are built on this foundation, but they differ in how far they progress within those steps.
-
Premium
Premium strategies are those that clear all six development stages, including the most demanding robustness tests in Steps 4 and 5. That means they not only perform strongly in-sample, out-of-sample, and in Monte Carlo simulations, but also prove themselves on multiple instruments and completely unseen data.
The result is a higher level of consistency, resilience, and adaptability across market conditions, making Premium products the choice for traders seeking maximum robustness and long-term reliability. -
Standard
Standard strategies are those that successfully pass the core robustness checks of Steps 1–4 and demonstrate profitability in live SIM testing (Step 6). They may show strong results on their primary instrument but having limited results on additional instruments within Step 5.
These strategies remain robust, trader-ready, and excellent value, offering reliable systems for traders seeking affordable automation without compromising on discipline or risk management.
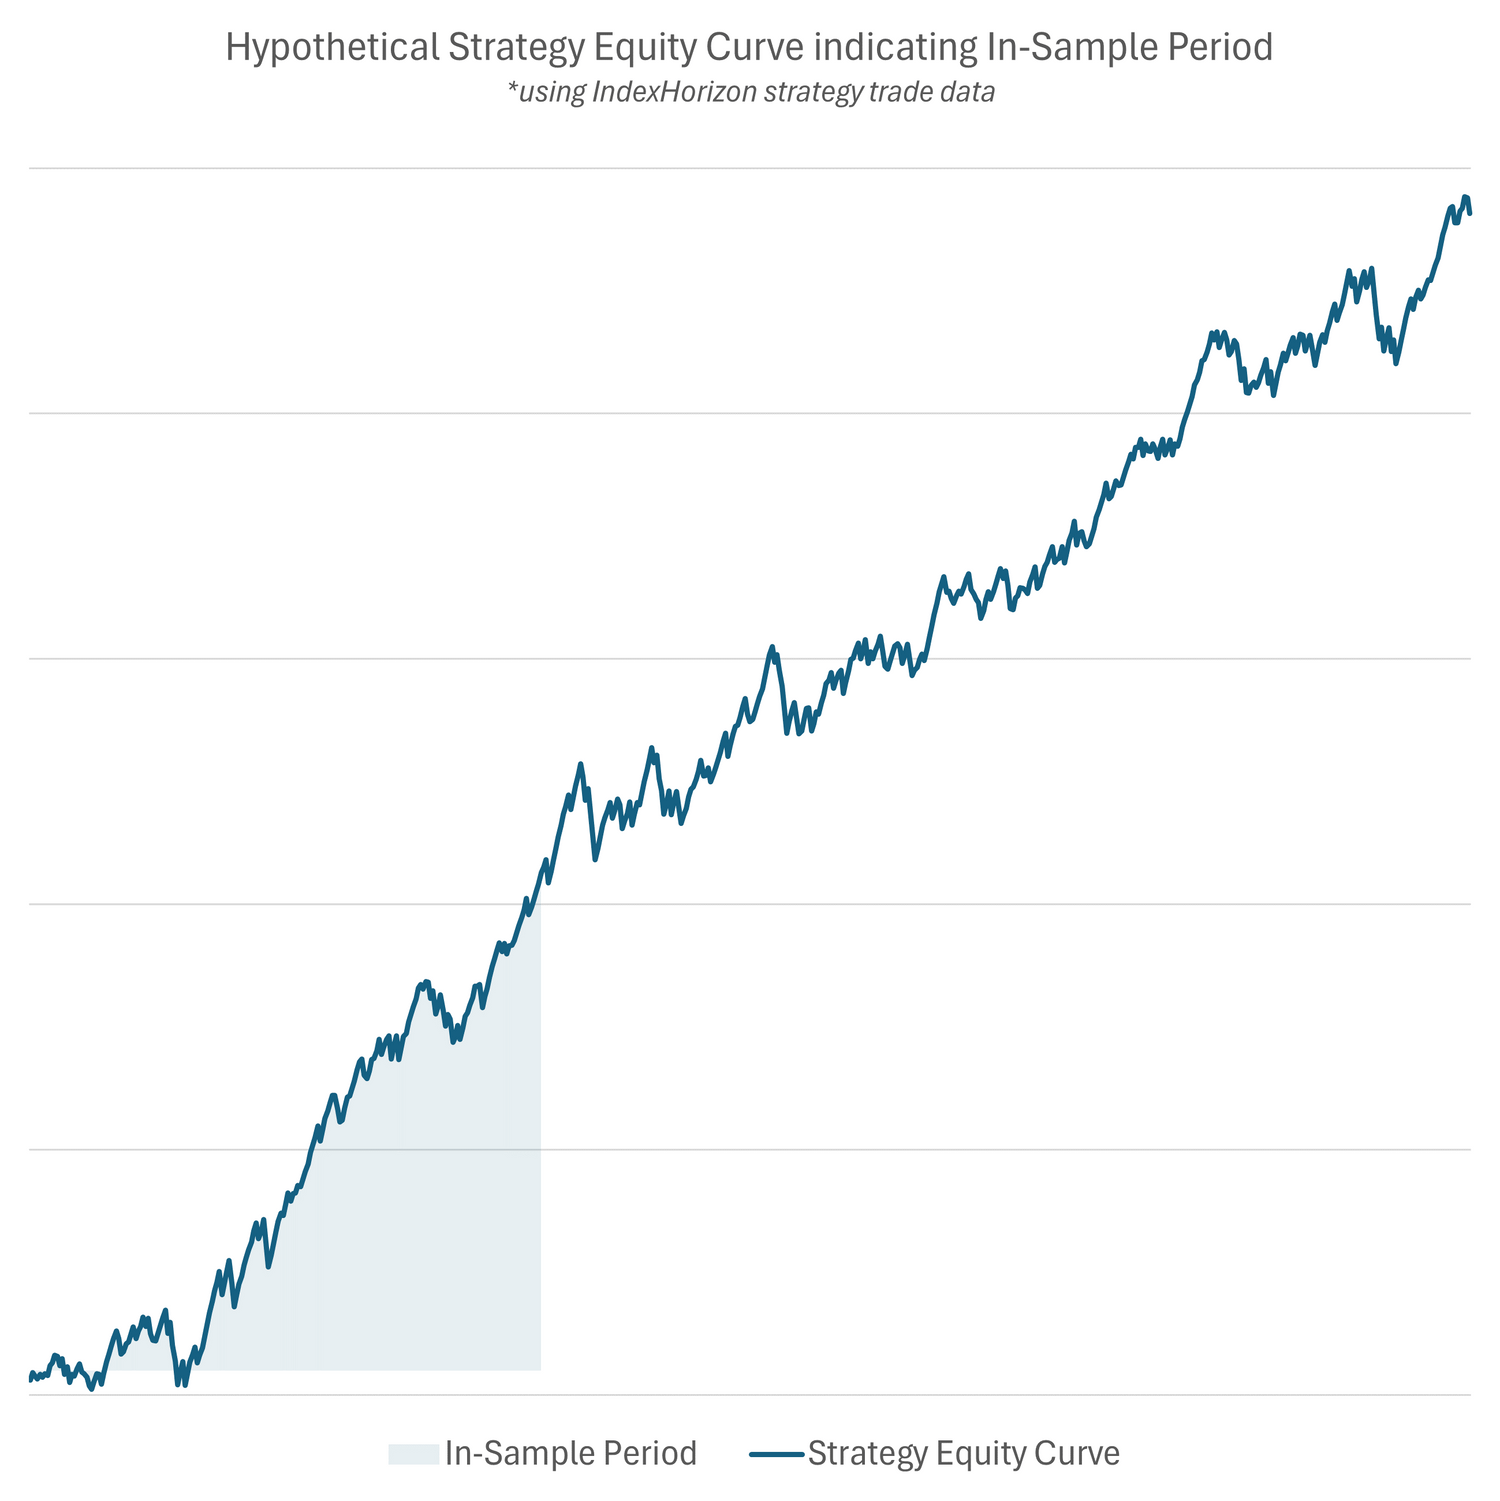
Step 1: Idea Proving
Each concept is first backtested on in-sample data, typically covering two years across different market regimes. Parameters are optimised carefully, but with limited iterations to prevent over-fitting. Only strategies achieving a risk-adjusted performance Net Profit / Max Drawdown ratio greater than 2 move forward.
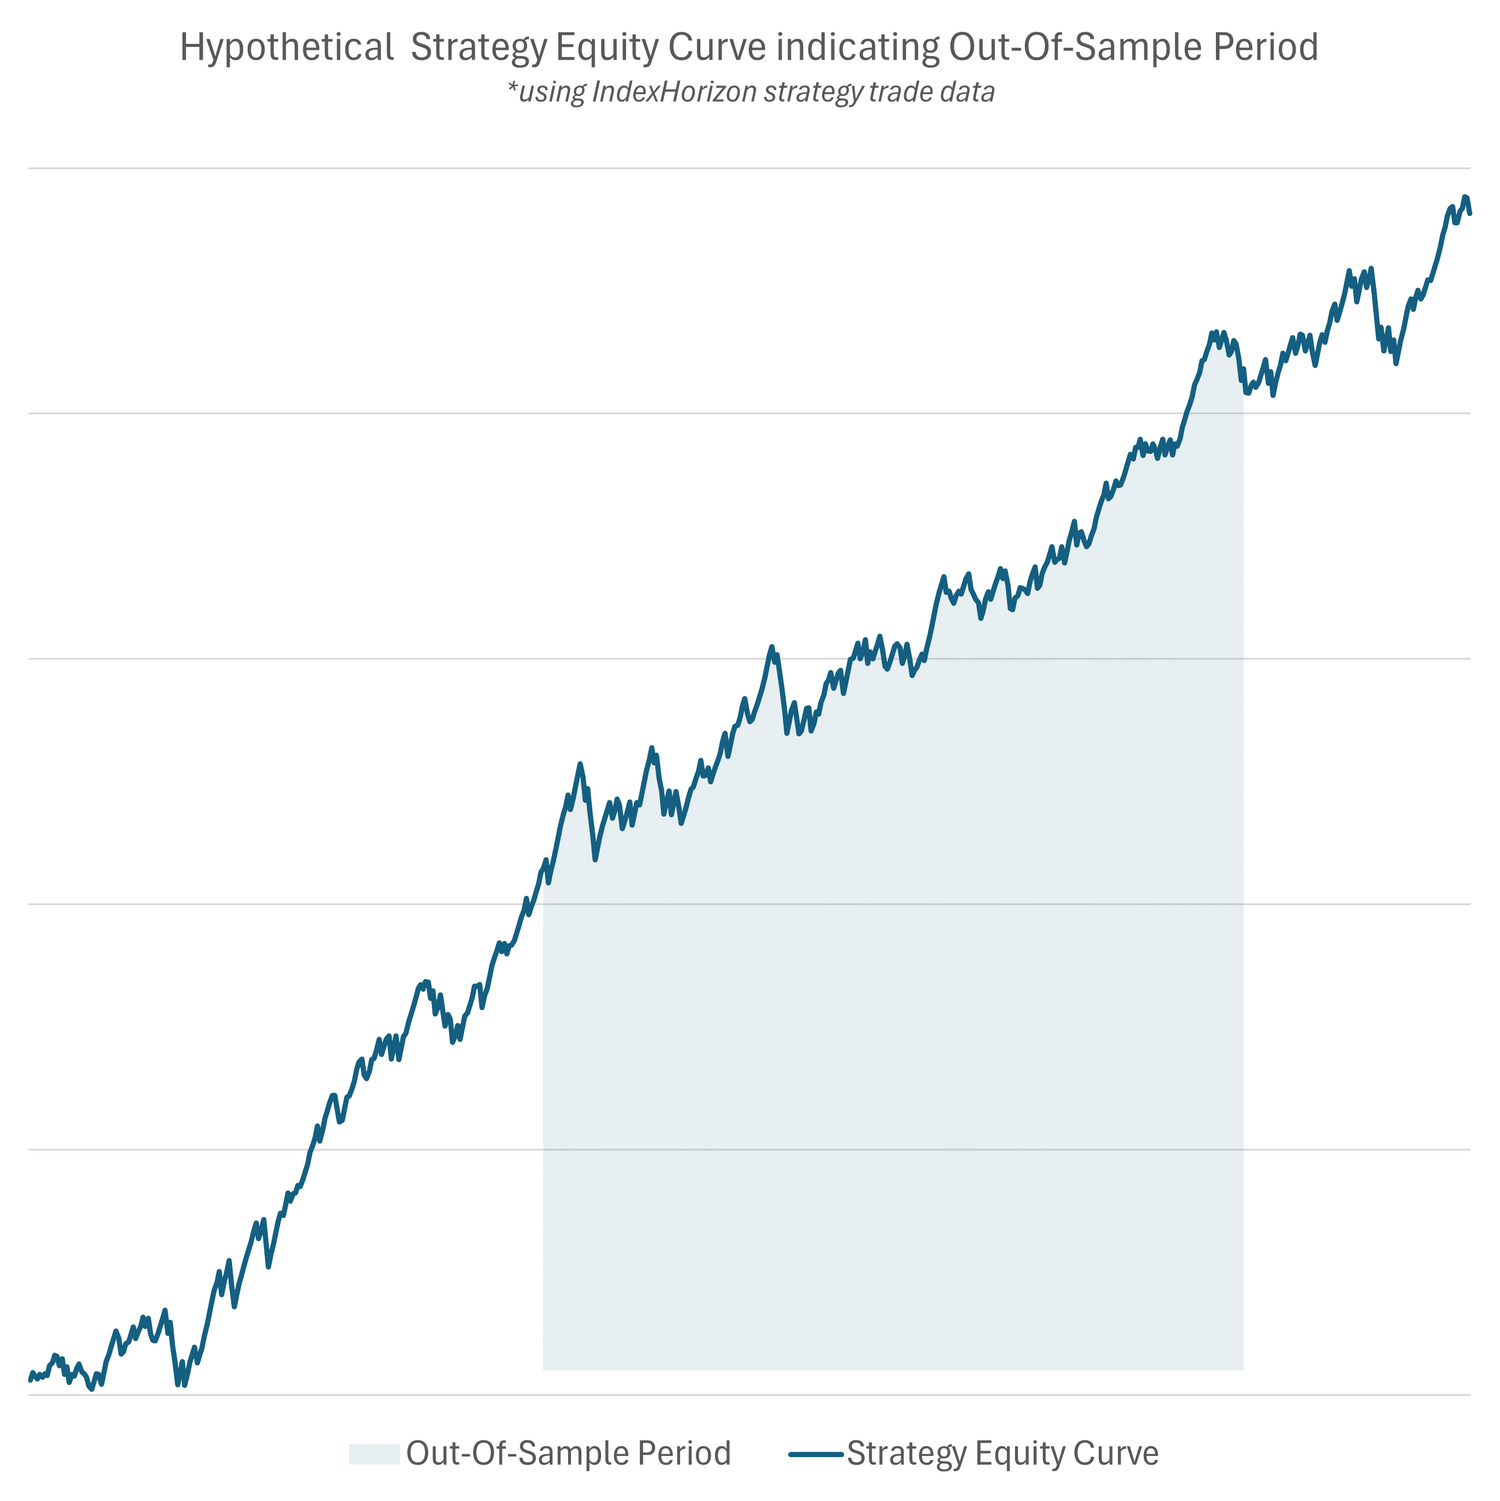
Step 2: Out-of-Sample Testing
The strategy and selected parameters are then tested on out-of-sample data—a fresh three-year window that covers additional market conditions. We do not re-optimise here; instead, we check for parameter sensitivity to ensure results are not dependent on one fragile setting. Again, only strategies with a risk-adjusted drawdown ratio above 2 progress.
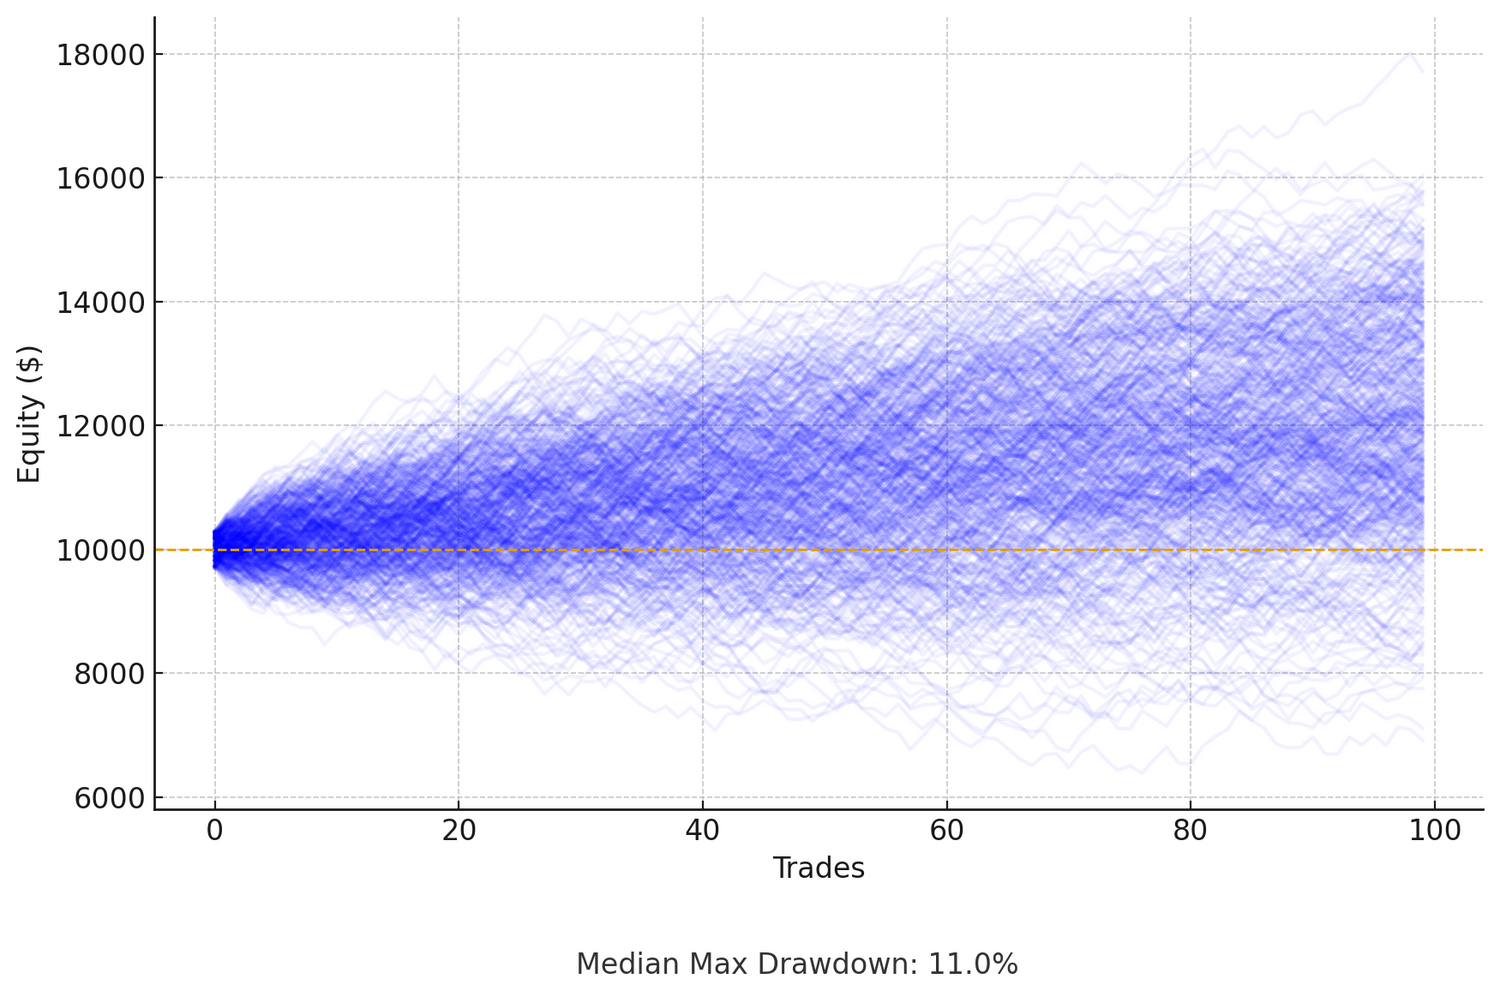
Step 3: Monte Carlo Analysis
To guard against curve-fit results, we perform Monte Carlo simulations on out-of-sample data, generating thousands of randomized trading paths. This provides a realistic view of potential drawdowns, risk, and profit distributions, ensuring the strategy remains robust under stress.
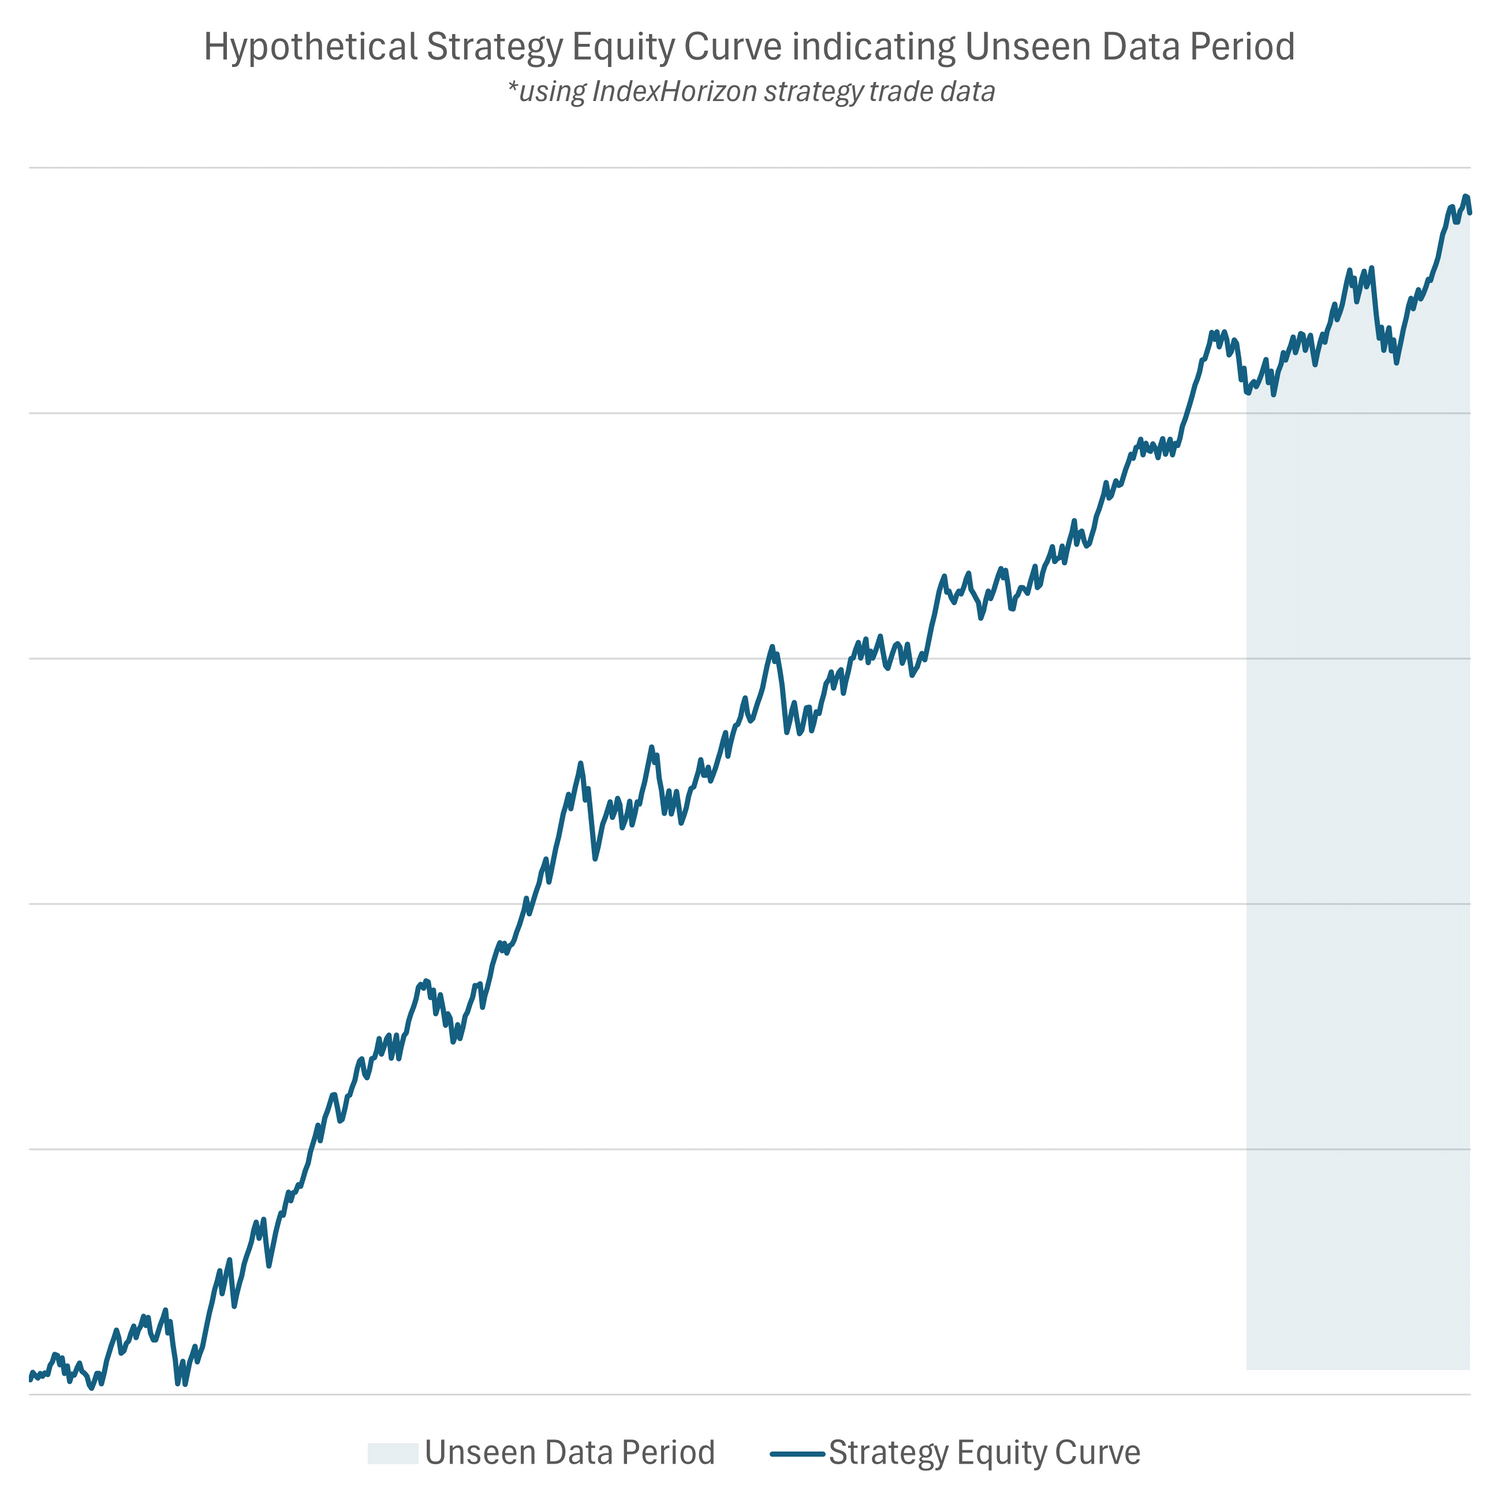
Step 4: Unseen Data Testing
Next, we evaluate the strategy on completely unseen data—data never touched in earlier development. For intraday systems, this is at least 8 months of fresh data; for swing systems, a minimum of 5 years. This step confirms that the strategy can perform outside the development sample.
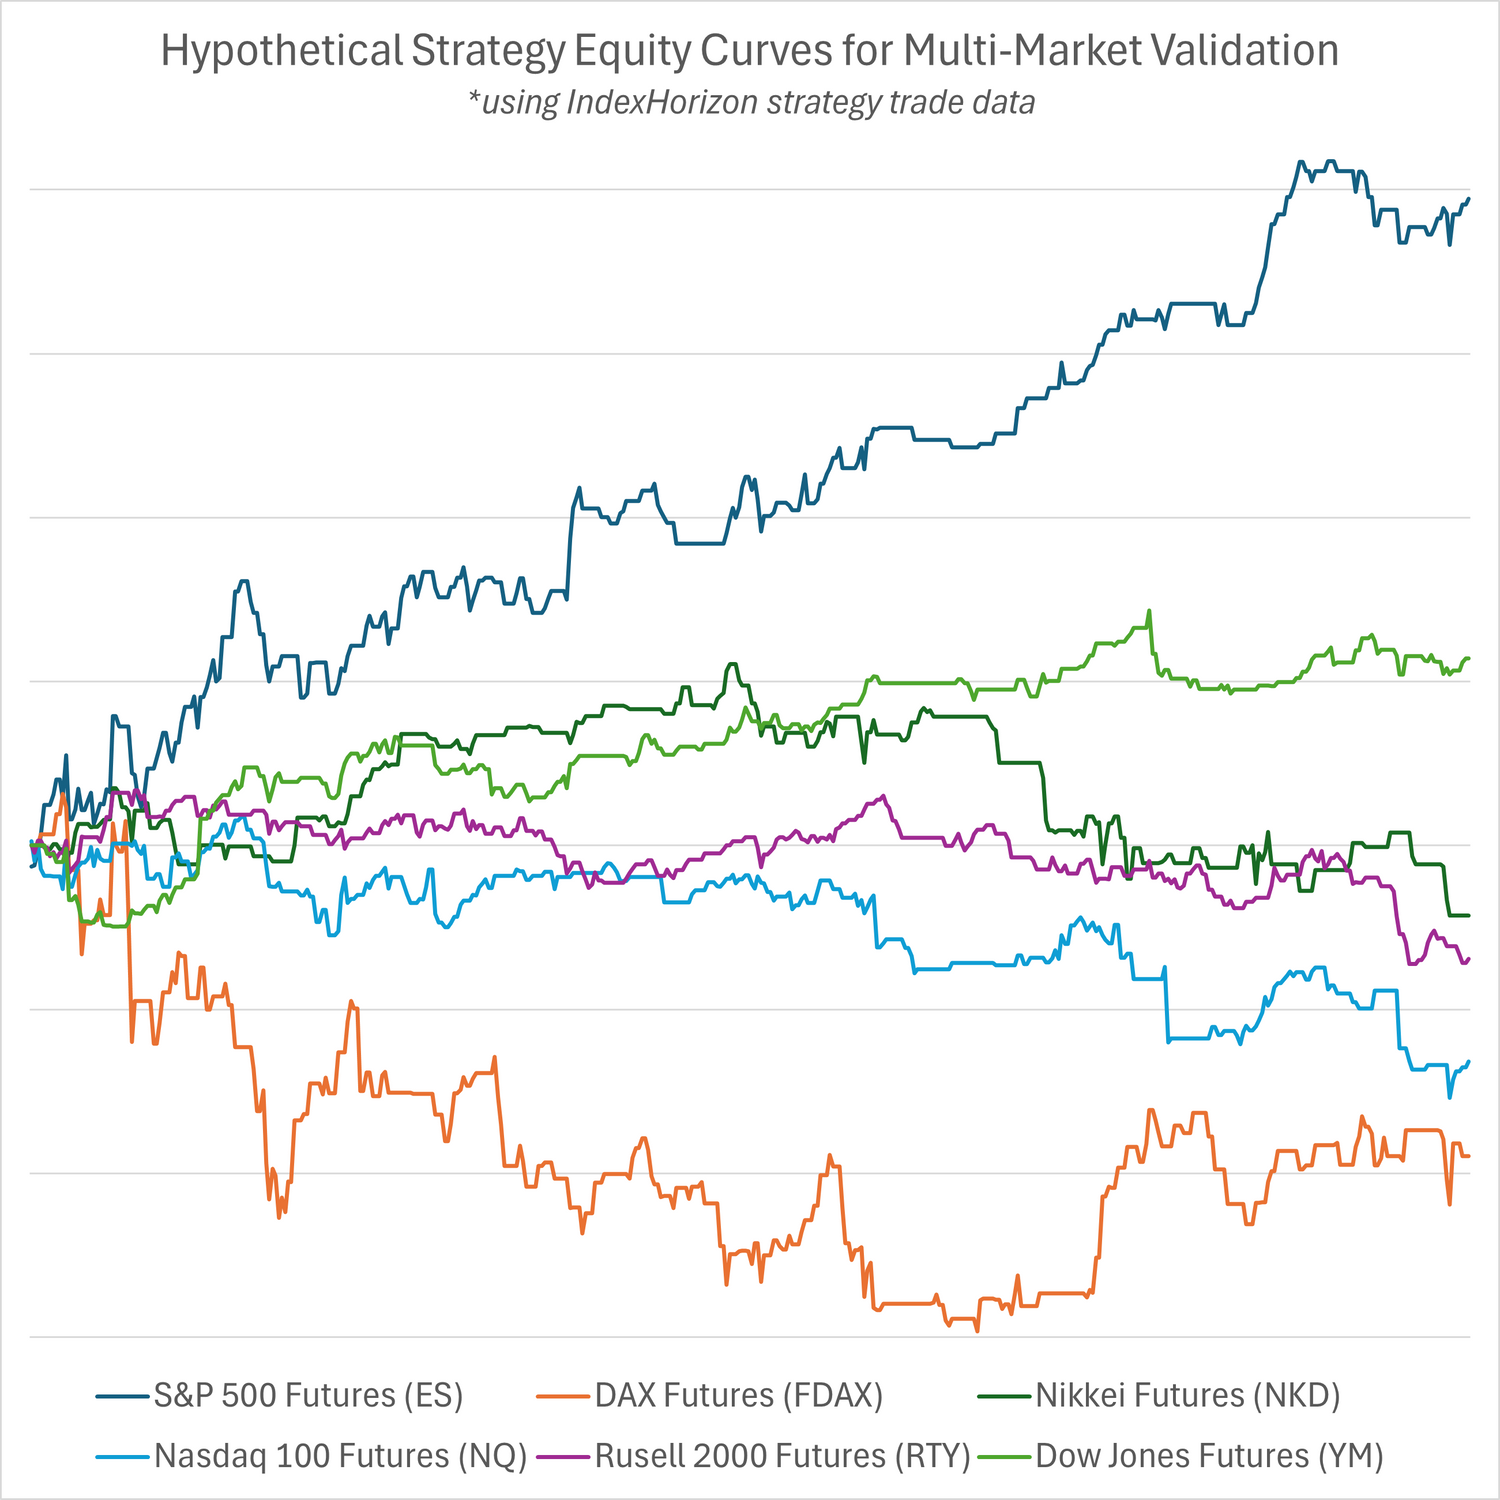
Step 5: Multi-Market Validation
Strategies are tested on other futures instruments to check for generality. If a system fails everywhere else, it’s likely over-fit to its original market. Only strategies that show profitability across two or more additional instruments advance.
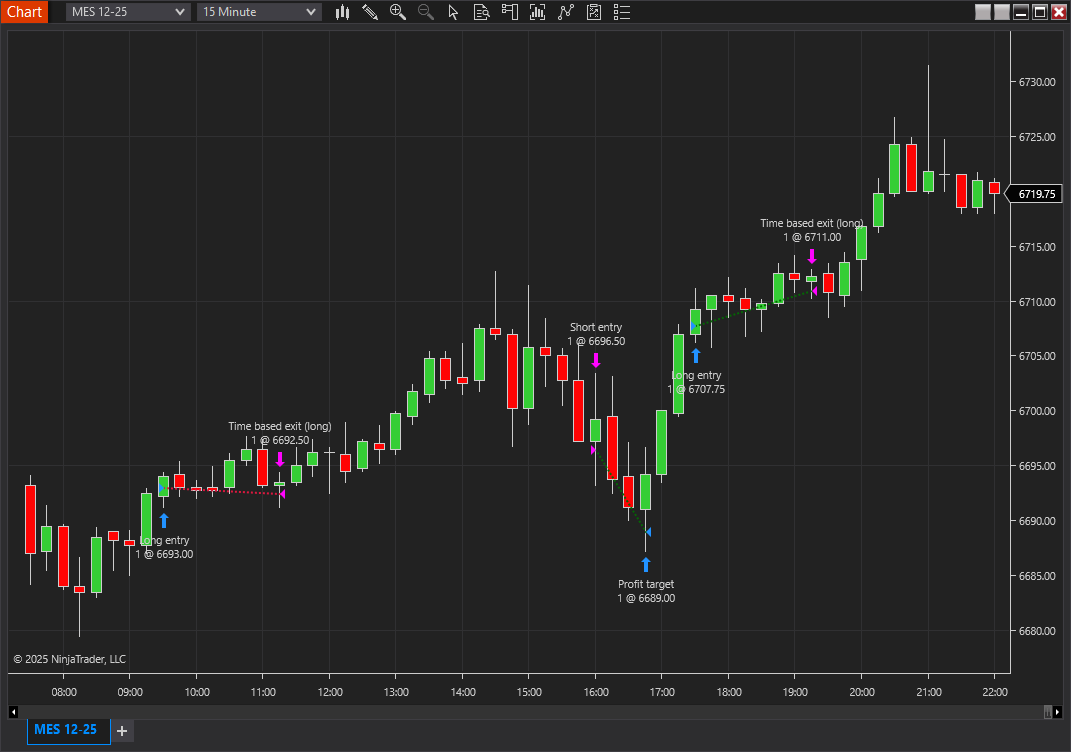
Step 6: Live SIM Testing
Before release, strategies run in a live SIM environment for a minimum of three months. Here we check for profitability and that live results align closely with historical backtests, confirming realistic execution and profitability.
Portfolio-Level Testing
On request, we offer a portfolio-building service, where we curate a diversified set of strategies tailored to your needs. For these portfolios, we take validation a step further with comprehensive portfolio-level testing to ensure low correlation and robust risk-adjusted performance.
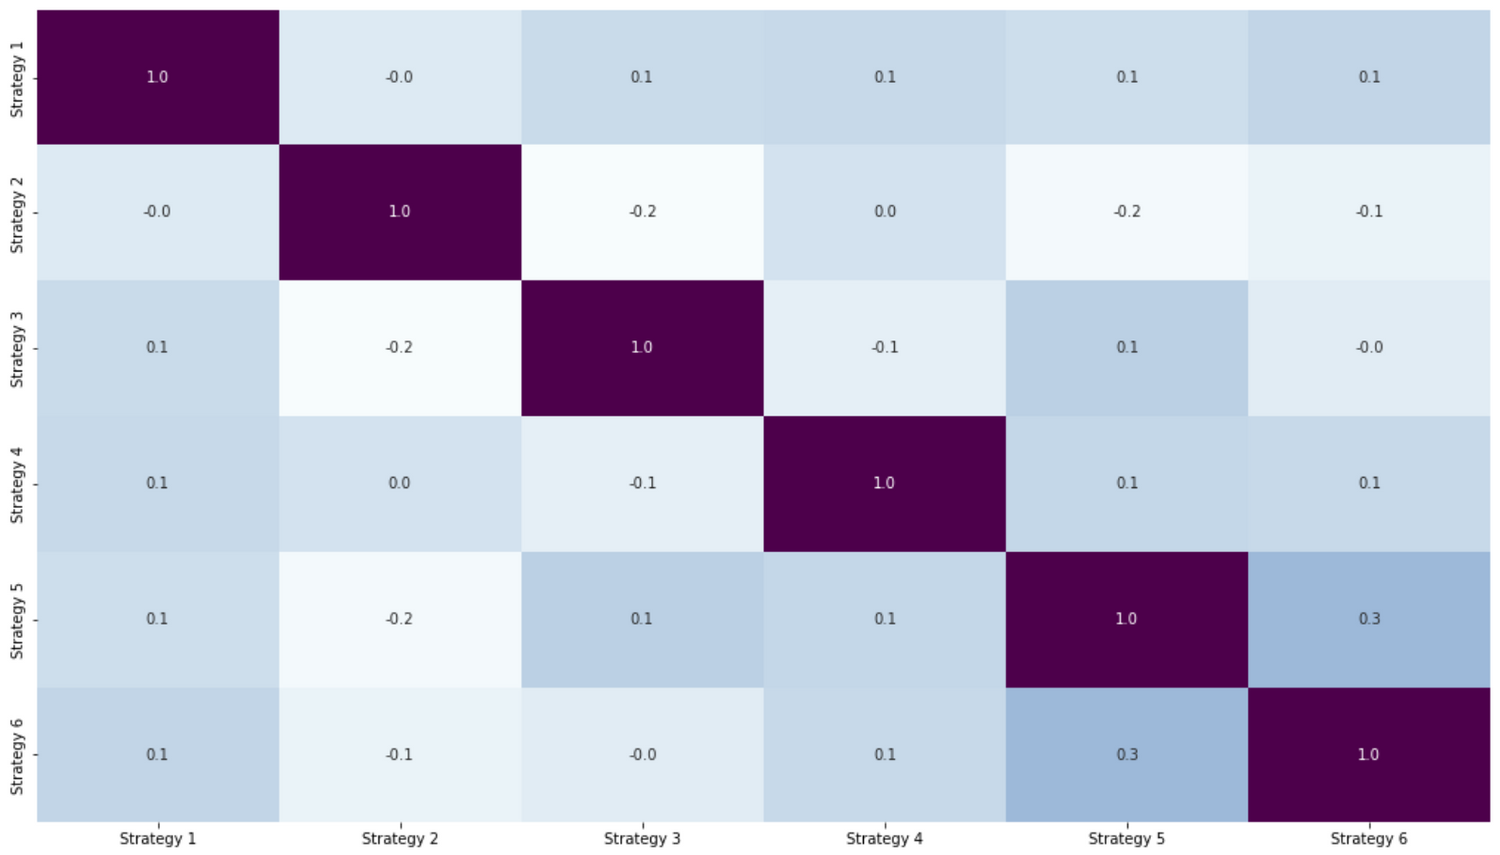
Step 7: Correlation Analysis
We ensure each strategy is lowly correlated (<20%) with others in the portfolio, so diversification enhances stability rather than stacking similar risks.
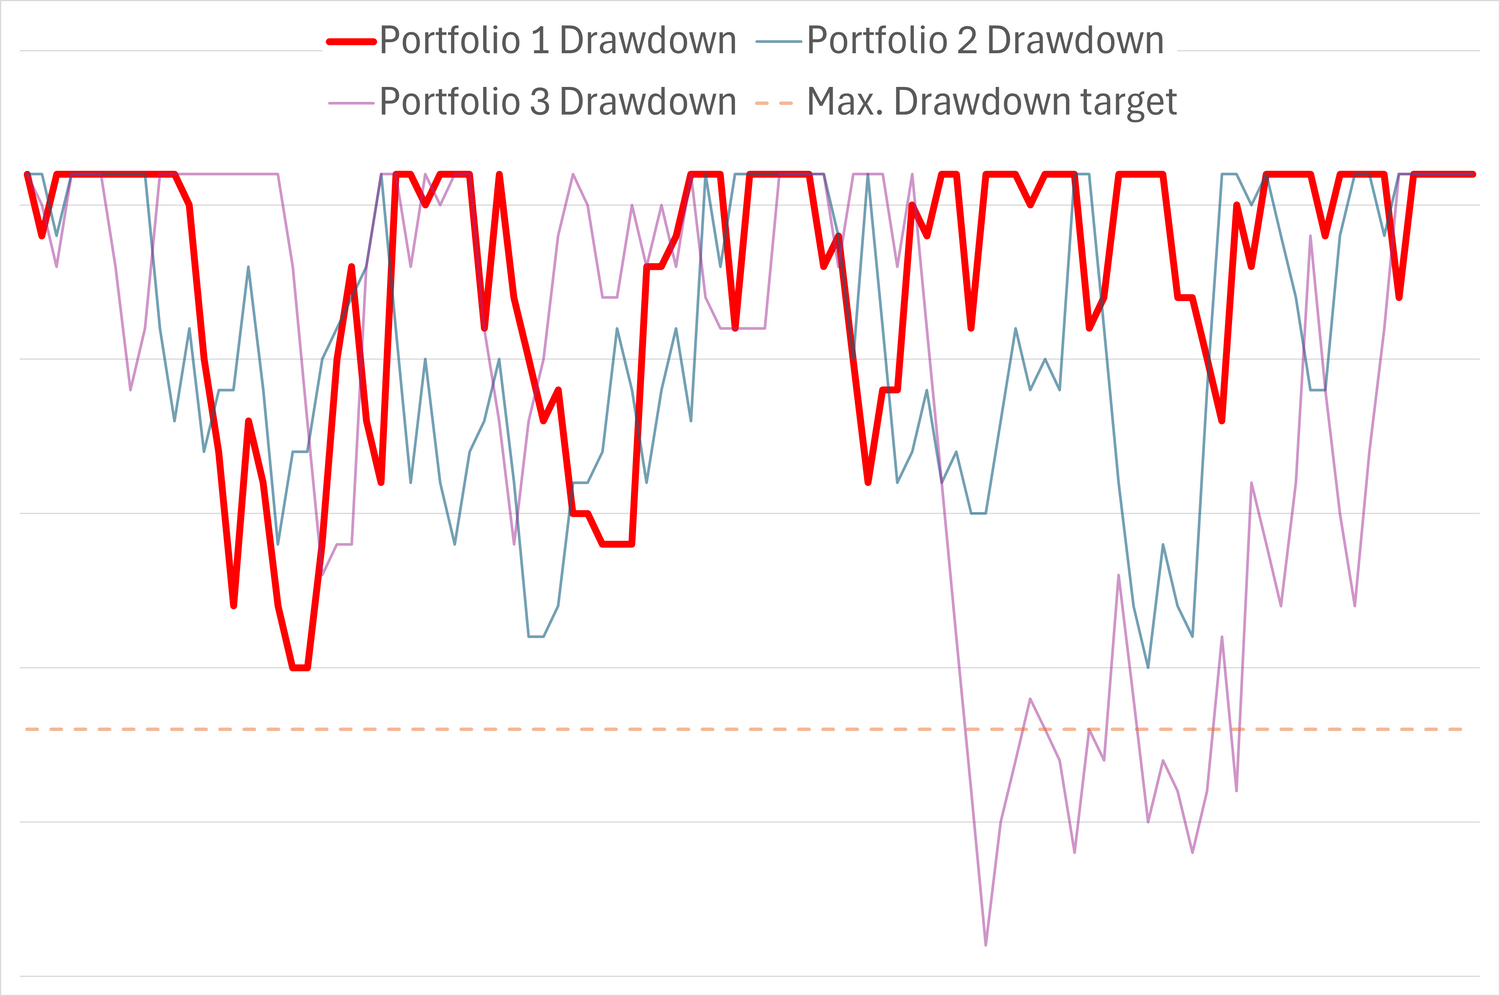
Step 8: Risk-Adjusted Portfolio Analysis
We examine the portfolio’s drawdown profile, only adding strategies that do not worsen the maximum drawdown or reduce the overall profit-to-drawdown ratio.

Go beyond single systems: let us design a low-correlation strategy portfolio for you.
We’ll review your requirements and recommend a blend of complementary strategies from our store.